Objective:
1. To understand the basic operation the atomic absorption spectroscopy (AAS)
2. To determine the main factors that can affect the absorption’s ability of AAS
Results:
Part A
Table 1 Absorbance of standard solution with different concentration
| Concentration of standard solution of Ca2+ (mg dm-3) | Absorbance |
| 1.0 | 0.045 |
| 2.0 | 0.079 |
| 3.0 | 0.114 |
| 4.0 | 0.148 |
A graph of Ca2+ absorbance vs concentration of Ca2+ was plotted.
Part B
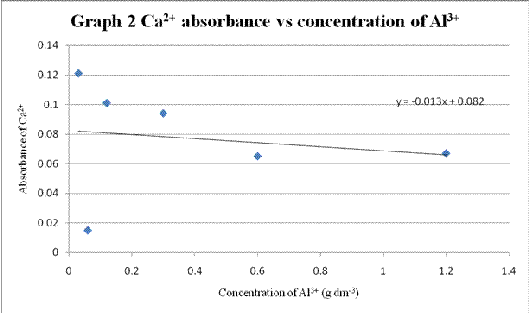
Table 2 Absorbance of calcium solution when different concentration of aluminium chloride solution added
| Volume of AlCl3 added (cm3) | Concentration of Al3+ (g dm-3) | Absorbance of Ca2+ |
| 0.0 | 0.00 | 1.301 |
| 0.5 | 0.03 | 0.121 |
| 1.0 | 0.06 | 0.015 |
| 2.0 | 0.12 | 0.101 |
| 5.0 | 0.30 | 0.094 |
| 10.0 | 0.60 | 0.065 |
| 20.0 | 1.20 | 0.067 |
A graph of Ca2+ absorbance vs concentration of Al3+ was plotted (Graph 2).
Part B (II)
Table 3 Absorbance of calcium solution when different concentration of aluminium nitrate solution added
| Volume of Al(NO3)3 added (cm3) | Concentration of Al3+ (g dm-3) | Absorbance of Ca2+ |
| 0.0 | 0.00 | 0.821 |
| 0.5 | 0.01 | 0.594 |
| 1.0 | 0.02 | 0.267 |
| 2.0 | 0.04 | 0.053 |
| 5.0 | 0.10 | 0.011 |
| 10.0 | 0.20 | 0.002 |
| 20.0 | 0.40 | – 0.001 |
A graph of Ca2+ absorbance vs concentration of Al3+ was plotted (Graph 3).
Part B (III)
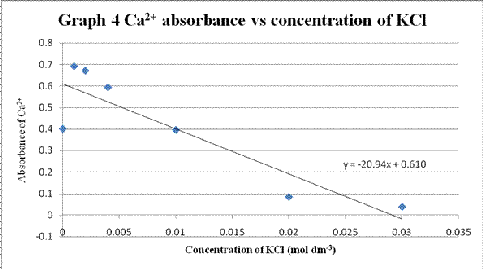
Table 4 Absorbance of calcium solution when different concentration of potassium chloride solution added with the presence of aluminium chloride
| Volume of KCl added (cm3) | Concentration of KCl (mol dm-3) | Absorbance of Ca2+ |
| 0.0 | 0.000 | 0.400 |
| 0.5 | 0.001 | 0.691 |
| 1.0 | 0.002 | 0.671 |
| 2.0 | 0.004 | 0.593 |
| 5.0 | 0.010 | 0.395 |
| 10.0 | 0.020 | 0.084 |
| 15.0 | 0.030 | 0.037 |
A graph of Ca2+ absorbance vs concentration of KCl was plotted (Graph 4).


No comments:
Post a Comment