Friday, December 23, 2011

Polymers Identification

Objectives:

1. To identity the types of polymer by using water

2. To identity the types of polymer by using copper wire

3. To identity the types of polymer by using alcohol

4. To identity the types of polymer by using acetone

5. To identity the types of polymer by using oil

6. To identity the types of polymer by using heat

Introduction:

Polymers are long chain organic molecules that are assembled from many identical and smaller molecules called monomers. Polymerization of is the process to assemble all the monomers together in order to form a huge and complicated molecule.


image Monomer of high density polyethylene


imageMonomer of polyvinyl chloride


Polymer is containing many units of monomer in its long chain. When there is a lot of monomer joining together chemically, polymer is formed, which shown in the picture below:

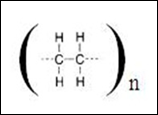
image Polymer of high density polyethylene


Generally, we can use the symbol below to show the structure of polymer instead of drawing the whole structure of polymer. Besides, we are not able to draw the whole structure because the number of monomer is usually over hundreds or even thousands of units.

The above picture refers to the simple structure in which it shows the whole structure of polymer or we named it as molecular formula as well.

The polymers shown in the picture above are the most common polymer that we always see and use in daily life. These includes polyethylene terephthalate (PETE), high density polyethylene (HDPE), polyvinyl chloride (PVC), low density polyethylene (LDPE), polypropylene (PP) and polystyrene (PS). These polymers are classified as class 1, followed by class 2, class 3 and so on. Identification of polymer by simply observing its appearance is difficult to differentiate them. However, we can identify them by using water, copper wire, alcohol, acetone, oil and heat.

Lassaigne's Test or Sodium Fusion test is also can be used to identify some of the polymers. For example, the presence of nitrogen, N in polyamides, and the presence of chlorine, Cl in PVC can be identified by using sodium fusion test. Besides, IR also can be used to identify the type of polymer via their major functional groups. The carbonyl stretches, O-H stretches, aromatic bends, etc could clearly show the identity of a polymer. Despite these test can be applied in identifying polymers, but today we only focus on the simplest test.

image

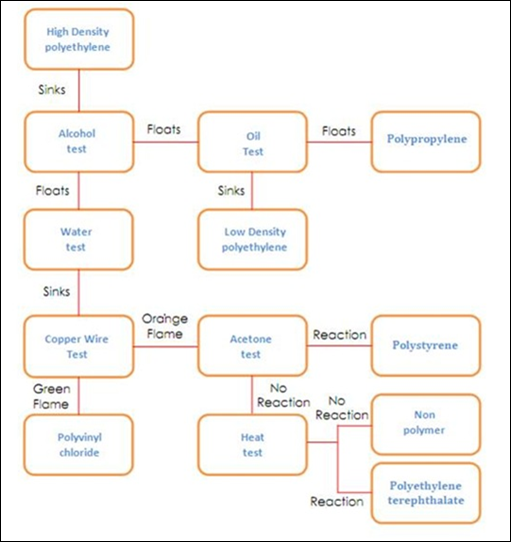
In this experiment, we will use some known plastic material and carry out some tests to identify the types of polymer. The flow chart below shows the overall tests on polymer identification.

image

We will use another three unknown sample of plastic to perform the test on them in order to identify the unknown samples.

Material:

Samples of polyethylene terephthalate (PETE), high density polyethylene (HDPE), polyvinyl chloride (PVC), low density polyethylene (LDPE), polypropylene (PP) and polystyrene (PS), three unknown samples of plastic, isopropyl alcohol, corn oil, copper wire, acetone

Apparatus:

Test tube, test tube rack, stopper, Bunsen burner, beaker, forceps, gauze wire

Procedure:

A) Water test

1. Pour 10ml of water into a test tube.

2. Place one of the samples into the water and stir the water by using a glass rod.

3. Observe whether the sample sink or float on the water surface.

4. Remove the sample from water and dry it for later use.

5. Repeat steps 1 to 4 by using each of the samples.

6. Take the samples that sank in the water for copper wire test while save the floated sample for alcohol test.

B) Copper wire test

1. Obtain a piece of copper wire about 6cm long and insert it into a small cork.

2. Burn the copper wire by using a Bunsen burner and heat until it is red hot.

3. Remove the copper wire from flame and touch on the sample of plastic. A small amount of sample should melt.

4. Place the wire copper with sample into the flame. A luminous flame is observed.

5. Repeat steps 1 to 4 by using the samples which sank in the water.

C) Acetone test

1. Prepare 20ml of acetone into a beaker under the fume hood.

2. By using a forceps, place the sample of plastic into the acetone for 15 seconds.

3. Remove the sample and press it firmly.

4. Scrape the sample to observe if the outer layer has softened.

5. Repeat steps 1 to 4 on the sample that gave yellow-orange flame.

D) Heat test

1. Prepare 100ml of water in beaker and heat it until boil.

2. By using a forceps, place the sample of plastic into the acetone for 15 seconds.

3. Remove the sample and press it firmly.

4. Scrape the sample to observe if the outer layer has softened.

5. Repeat steps 1 to 4 on the sample that shown negative result in acetone test.

E) Isopropyl alcohol test

1. Pour 10ml of isopropyl alcohol into a test tube.

2. Place one of the samples samples that floated on the water surface into the test tube and stir the water.

3. Observe whether the sample sink or float on the surface.

4. Remove the sample from water and dry it for later use.

5. Repeat steps 1 to 4 by using the samples that floated on the alcohol surface.

F) Oil test

1. Pour 10ml of oil into a test tube.

2. Place samples that floated on the alcohol surface into the test tube and stir the sample.

3. Observe whether the sample sink or float on the surface.

4. Repeat steps 1 to 4 on the unknown samples

Precaution steps:

1. Carry out the test under a fume hood.

2. Avoid the isopropyl alcohol and acetone from any sources of flame.

3. Hold the wire copper by using a forceps after heated.

4. Equip with personal protective equipment such as glove and mask.

Monday, December 19, 2011

Qualitative Analysis of Organic Compounds (Sodium fusion Test or Lassaigne Test)

Objective:

1. To carry out Lassaigne test in order to determine the elements (N,S halogens) present in the unknowns.

2. To identify the elements present in compounds and their colouration.

Introduction:

Qualitative analysis is always applied as a first step in identifying a compound when a new compound is readily prepared or isolated from some natural source. In an organic compound, elements carbon, hydrogen and oxygen are assumed to be present commonly. Nitrogen, sulphur and halogens (chlorine, bromine and iodine) may also present in the organic compound. The identification of elements in a given compound is a type of qualitative analysis since the experiment is dealing with the composition of a unknown compound. This experiment must be handled very carefully as further the analysis of the organic compound is according to the element present in it. Generally, the traditional technique is only can be applied to inorganic ions in aqueous solution.

When a new compound contains covalent bonding instead of ions, its molecule can be broken up into ions by controlled decomposition of the compound. The reagent used which cause the decomposition of the original unknown compound into the ions produced by the decomposition will reflect clearly those elements that were present initially in the compound. In this experiment, sodium fusion test (Lassaigne’s test) is used in elemental analysis of qualitative determination of elemental halogens, sulphur and nitrogen in a sample. Sodium is a very strong reducing agent that will able to break up the organic compounds carbon atom chain. It also will convert the atoms which are covalently bonded to the carbon chain to inorganic ions. The elements are detected by sodium fusion test. The organic compound is fused with metallic sodium to convert these elements into ionic mixture which dissolved in water and the filtrate is used to perform the tests.

The organic compound undergoes sodium fusion test which the carbon present in the particular compound is reduced partially to elemental carbon. The nitrogen present in the compound is reduced to cyanide ion, CN- while the sulphur present is converted into the sulfide ion, S2-. Any halogens (Cl, Br, I) that are present in the compound are reduced to the halides ions, Cl-, Br- and I-. A precipitate of an iron/cyanide complex with the characteristic of dark blue colour (Prussian blue) will be formed if cyanide ion is present in the compound. If sodium is not heated well, very little amount of cyanide ion is produced during fusion test. So, a greenish solid may result. It is always helpful to repeat the sodium fusion test in order to confirm the presence of nitrogen if only the greenish solid is being produced.

Several techniques can be used to test the presence of sulfide ion in the unknown organic compounds. Hydrogen sulfide gas will be produced if the filtrate obtained from sodium fusion products is acidified. This can be noted by the formation of lead(II) sulphate precipitate is formed after the lead(II) ions introduced into the solution.

image

Besides, the sulfide ions can be tested by adding with sodium nitroprusside reagent. The formation of purple or violet colour shows the presence of sulfide ion. Silver ion reagent can be used to confirm the presence of halide ions in the compound. The formation of precipitate between halide ion and silver ion as shows below:

image

For the compound consists of more than one halogen, the mixed precipitate of silver halides can be observed as a result. However, it may be necessary to remove the cyanide ion and sulphide ion if they were present. Otherwise, these ions will precipitate with the silver ions to form precipitate which will mislead to the presence of halogens in the compound.

Apparatus:

Fusion tubes

Test tube

Evaporating dish

Gauze

Tongs

Materials

Sodium metal

Unknown organic compounds A,B,C

0.5M ferrous sulfate

0.5M ferric chloride

3M sulfuric acid

3M acetic acid

3M nitric acid

Sodium nitropusside

Lead acetate

0.1M silver nitrate

Procedure:

Part A: Sodium Fusion Test (Lassaigne)

1. 2-3 drops of unknown substance (for liquid) or 0.1g (for solid) was put into the fusion tube.

2. A piece of sodium was placed into the tube.

3. The tube was hold with a pairs of tong. The heating was gently to avoid spurting out of the sodium. When the sodium was molten, the compound was heated strongly until the end of the tube was red hot (continue heating for 1 minute).

4. The hot tube was plunged into 20ml of distilled water in a evaporating dish and covered with a gauze.

5. The tube was crushed with a pestle.

6. The mixture was filtered into a clean test tube. The colourless and clear filtrate was readily to be examined for the presence of nitrogen, sulphur, and halogens.

Part B: Test for nitrogen (Cyanide test)

1. To 1ml of filtrate, few drops of 0.5M ferrous sulfate was added and a dark green precipitate of iron(II) hydroxide is formed.

2. If sulphur is also present, precipitate will be black. More ferrous sulfate solution was added dropwise to precipitate all the sulphide ion until no more black precipitation is formed.

3. The mixture was heated to boiling with shaking, cooled and acidified with 3M sulfuric acid. If nitrogen is present, a blue colour (Prussian blue) appears immediately on addition of a trace of 0.5M ferric chloride solution.

Part C: Test for sulphur (sulphur test)

1. To 1ml of filtrate, a few drops of dilute solution of sodium nitroprusside were added. If sulphur ion is present, a deep purple colour will appear.

2. Alternatively, sulphide ion may be detected by precipitation as black lead(II) sulphide with lead(II) acetate solution which has been acidified by 3M acetic acid.

3. If halide is also present, white or yellow lead(II) sulphide precipitate may also formed.

Test for halogens

1. 1ml of filtrate was acidified with a few drops of 3M dilute nitric acid.

2. Silver nitrate solution was then added into the solution. Halides are indicated by the formation of a white or yellow precipitate.

Part E

The above procedure was repeated for unknown B and C. For each test, the observations were written down and the elements in the unknown were deduced.

Results:

Table 1 Observations of the unknown compounds on nitrogen test

Unknown

compound

Observation on nitrogen test

Inference

A

i) Some dark green precipitate and a little amount of dark precipitate were formed after brownish orange FeSO4 is added.

ii) The precipitate become greenish after more FeSO4 is added.

iii) The colour of precipitate remained unchanged after heating.

iv) The precipitate does not change after sulphuric acid is added.

v) Blue precipitate is formed immediately after adding of FeCl3

Nitrogen is present.

B

i) The solution turns to yellow after brownish orange FeSO4 is added.

ii) Brownish orange precipitate is formed after heated.

iii) Colourless solution is formed after H2SO4 is added.

iv) No change after FeCl3 is added.

Nitrogen is absent.

C

i) The solution turns to yellow after brownish orange FeSO4 is added.

ii) Brownish orange precipitate is formed after heated.

iii) Colourless solution is formed after H2SO4 is added.

iv) No change after FeCl3 is added.

Nitrogen is absent.

Table 2 Observations of the unknown compounds on sulphur test

Unknown

compound

Observation on sulphur test

Inference

A

a) Sodium nitroprusside

i) A deep purple solution is formed immediately.

b) Acidified lead(II) acetate

i) A black precipitate is formed.

Sulphur is present.

B

a) Sodium nitroprusside

i) A pale yellow solution is formed.

b) Acidified lead(II) acetate

i) A white precipitate is formed.

Sulphur is absent.

C

a) Sodium nitroprusside

i) A pale yellow solution is formed.

b)Acidified lead(II) acetate

i) A white precipitate is formed.

Sulphur is absent.

Table 3 Observations of the unknown compounds on halogens test

Unknown

compound

Observation on halogens test

Inference

A

Formation of white precipitate after nitric acid and silver nitrate are added.

Halogen is present.

B

Formation of white precipitate after nitric acid and silver nitrate are added.

Halogen is present.

C

Formation of yellow precipitate after nitric acid and silver nitrate are added.

Halogen is present.

Discussion:

The organic compounds to be analyzed consist of basically of a chain of carbon atoms which various other atoms are attached. Since these elements are covalently bonded to the carbon chain, it is unable to dissolve in water to form cations and anions. However, sodium fusion test can be used to reduce those atoms that are covalently bonded to the carbon chain to inorganic soluble ions since sodium is a very strong reducing agent. In the Lassaigne’s test, the nitrogen can be reduced to form cyanide ions, CN-:

image

For sulphur, it had been reduced to form sulfide ion, S2- in Lassaigne’s test as shown in the following:

image

If both nitrogen and sulphur are present in the organic compound at the same time, then the chemical reaction below will take place in the test:

image

If halogens (Cl, Br, I) are present in the compound, the halogens will be reduced to form halide ions (Cl-, Br-, I-) during the sodium fusion test.

image

The inorganic ions in aqueous solution could be easily observed after undergo certain tests which can indicates the presence of elements in the particular compounds.

In the cyanide test, the filtrate of compound A was added with ferrous sulfate, a dark green precipitate was formed. The formation of ferrous hydroxide was produced from the reaction between ferrous sulfate and sodium hydroxide.

image

The sodium hydroxide was formed by the reaction of unreacted sodium metal with water due to incomplete reaction of sodium fusion with compound A.

image

The FeSO4 solution was added to confirm the presence of NaOH and to react completely with it in the filtrate. At the same time, a small amount of black precipitate was formed at the bottom but it was disappeared after more ferrous sulphate was added. The formation of black precipitate may be due to the ferrous sulphide exists in the mixture.

image

The equation below shows that the ferrous sulphate was reacted with the sodium cyanide to form sodium ferrocyanide as the main product.

image

The sulphuric acid and increase in temperature was used to increase the suitable medium for the formation of complex. As a result, ferric-ferrocyanide complex with the colour of Prussian blue was precipitated out after ferric chloride is added to oxidize the Fe2+ to become Fe3+. This Prussian blue precipitate indicates that the unknown A contains nitrogen in the compound.

image

Some of the Fe3+ was formed before the oxidation of ferric chloride. This might be due to the air oxidation of iron(II) ions in the mixture before the ferric chloride is added. For compounds B and C, a negative result is obtained which end up with colourless solution as results. Hence, these shown nitrogen are absent in the both organic compounds.

The reduced sulfide ion can be confirmed by using two different tests which were sodium nitroprusside test and lead(II) acetate test. For the first test, the appearance of deep purple solution shows the positive result. The formation of sodium sulphonitroprusside is a complex that was formed between the sodium nitroprusside and sodium sulphide.

image

In another test, the black precipitate will be formed if the sulphur is present in the compound. The formation of black precipitate shows a positive result for this test.

image

The compounds B and C did not consisting sulphur in their structure because they cannot give the positive result on both tests. A pale yellow solution was formed after sodium nitroprusside was introduced and the solution shows the colour of sodium nitroprusside. In the latter test, white precipitate was formed may be due to the precipitation of the lead (II) ions with the halide ions. Based on the observation, the organic compound A containing sulphur while compound B and C did not containing sulphur.

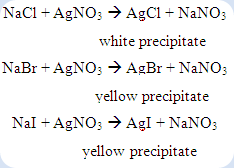
In the halogens test, if white or yellow precipitation takes place after silver nitrate was added into the filtrate from compound A, B and, C respectively is known as the positive result. If cyanide ion or sulfide ion present in the compound, the acidified solution must be heated until boiled in order to expel the hydrogen cyanide gas and hydrogen sulfide gas. This step was taken to avoid the cyanide ions and sulfide ions cause the error in the halogens test. The sodium halide formed during the sodium fusion test was reacted with the silver nitrate to form the insoluble silver halide as precipitate in the solution.
image

The white precipitate was formed in the filtrate from compound A while yellow precipitate were formed in the both filtrate from the compound B and C. This is mean that the halogen presents in the compound A probably is chlorine whereas the halogens exist in the compound B and C were possibly bromine or iodine.

Precaution steps:

1. Safety glasses should be worn in the laboratory at all the time.

2. Do not add too much of water into the sodium fusion products unless if has been established with certainly that all elemental sodium has been destroyed.

3. The fusion of unknown compound is carried out in the fume hood.

4. When heating the liquids, use a small flame instead of large and move the test tube quickly through the flame.

5. The heating process of unknown compound must carried out in fume hood.

6. Avoid the corrosive sulfuric, nitric and acetic acids touch on skin because it can be dangerous to skin.

Thursday, December 15, 2011

The Use of Volumetric Flask, Burette and Pipette in Determining the Concentration of NaOH Solution

Objectives:

1. To carry out titration of a strong acid (HCl) with a strong base (NaOH).

2. To determine the end point of titration with the use of phenolphthalein as indicator.

3. To determine the concentration of base when the concentration of acid is known by doing calculations related to titration.

Introduction:

The main purpose of this experiment is to determine the unknown concentration of a known reactant. Volumetric analysis is a method of quantitative chemical analysis that always used in titration. The technique is carried out by using a reagent of a known concentration (standard solution) and volume to react with a solution where the concentration is unknown. There are various types of titration carried out for different purposes such as acid-base titration and redox titration. Within the acid-base titration, there are four types of reactions:

(1) titration involving a strong acid and a strong base

(2) titration involving a weak acid and a strong base

(3) titration involving a strong acid and a weak base

(4) titration involving a weak acid and a weak base

The titration carried out is the acid-base titration which is based on the neutralization reaction that occurs between an acid and a base to produce salt and water. The base is added slowly into the conical flask with acid until there are all exactly reacted. This is called the end point or also known as the equivalence point of the reaction.

The equivalence point of the neutralization reaction is the point at which both acid and base have been consumed and neither is in excess. In other words, the hydrogen ion and hydroxide ion concentrations are equal in the solution. In order to determine the equivalence point in a titration, acid-base indicators need to be added to the acid solution before the titration start. The end point of a titration is indicated when the indicator changes color. An indicator is a weak organic acid or base that has distinctly different colors in its non-ionized and ionized forms. This will be discussed further in discussion section. Different indicators show different colour changes at the same pH, therefore choosing of indicator for a particular titration depends on the acid and base used.

Hydrochloric acid (HCl) and sodium hydroxide (NaOH) is used as the reactants in this experiment. HCl is a monoprotic acid which dissociate to give out one H+ ion. Monoprotic acids have acid dissociation constant, Ka, which indicates the level of dissociation in water. Hydrochloric acid has large Ka value as it is a strong acid and dissociate completely in water. NaOH is a metallic base and ionic which composed of sodium cation and hydroxide anion. The hydroxide ion makes sodium hydroxide a strong base which reacts with acids to form water and corresponding salts.

Procedure:

  1. Volumetric flask was cleaned and rinsed with distilled water.
  2. 25ml of NaOH solution was transferred into the volumetric flask.
  3. The volumetric flask was topped up to 250ml with distilled water and rotated several times.
  4. Burette was cleaned with distilled water and rinsed with 5ml NaOH solution few times and was filled.
  5. Pipette was cleaned and rinsed a few times with HCl.
  6. 25ml of HCl solution was pipetted into 3 conical flasks.
  7. 3 drops of phenolphthalein was added into HCl solution.
  8. The initial and final readings of burette were recorded.


Result and calculations:

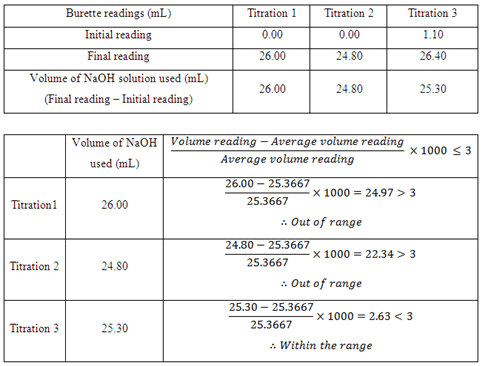
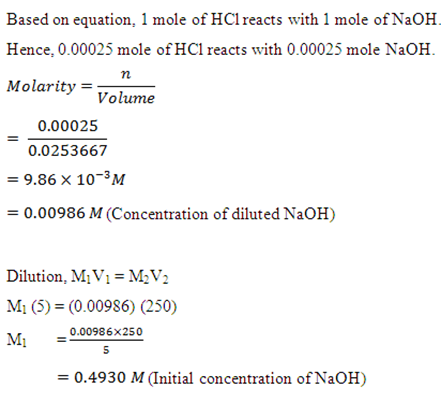
image


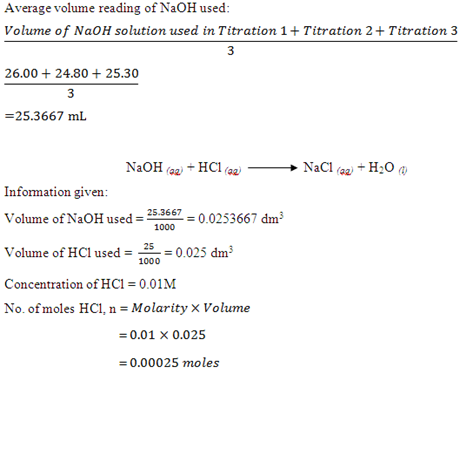
 image


image 

Discussion:

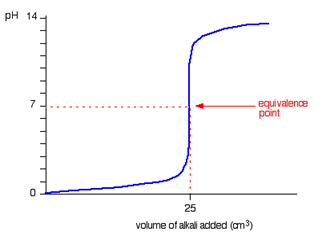
The titration of a strong acid and strong base in this experiment can be illustrated with a graph called a titration curve. It is a graph of pH versus volume of the solution titrated. The figure below represents the pH versus volume data of the titration curve for the HCl-NaOH titration. From the graph we may explain the chemical changes happen during titration and decide which indicators best to be used to determine the endpoint which matches the equivalence point of the neutralization.

image

Based on the graph, the pH has a low value at the beginning of the titration which shows the concentration of the HCl in conical flask. As the titration proceeds, the pH changes slowly until it reaches just before the equivalence point. At the equivalence point, the pH rises sharply by just adding only two drops of base. This is because when the equivalence point is reached, the number of moles of hydrogen ions and hydroxide ions is equal to each other; therefore a slight addition of base will result in a steep increase of pH. Beyond the equivalence point, the pH again rises only slowly. According to the graph, any acid-base indicator whose color changes in the pH range from about 4.0 to 10.0 is suitable for HCl-NaOH titration.

The acid-base indicator that is used for the titration of HCl-NaOH is phenolphthalein which is situated within the pH range of 8.3 to 10.0. Other indicators only have pH range within 1.0 to 8.8 which does not include the pH range beyond 9.0 as phenolphthalein where the pH range is until 10.0. Based on the interpretation of the graph, indicator whose color changes in the pH range from 4.0 to 10.0 is only suitable for the HCl-NaOH titration. Therefore phenolphthalein is chosen rather than the other indicators.

As we known an indicator is usually a weak organic acid or base that has distinctly different colour in its non-ionized and ionized forms, but what are the characteristics of an indicator that make let us determine the endpoint of a titration by showing different colours. Acid-base indicators exist in two forms, a weak acid represented as HIn and having one colour and its conjugate base represented as In- and having a different colour. The indicator does not affect the pH of the solution if only just a small amount of indicator is added to a solution. However, the ionization equilibrium of the indicator is affected by the concentration of H3O+ in the solution. When in a solution, the acid ionizes to the following ions:

clip_image032

Based on the Le Châtelier’s principle, increasing [H3O+] in the solution shifts the equilibrium to the left, increasing the amount of HIn and thus showing the acid colour. On the other hand, decrease in [H3O+] in a solution shifts the equilibrium to the right, increasing the amount of In- and hence displaying the base colour. In general, if 90% or more of an indicator is in the form HIn, the solution will show the acid colour. If 90% or more is in the form In-, the solution takes on the base colour. If the concentrations of HIn and In- are about equal, the indicator is in the process of changing from one form to the other and has an intermediate colour which is the mixture of acid and base colour.

Based on the results obtained, within the three titration carried out only Titration 3 is less than 3 and within the range. However, Titration 1 and 2 is more than 3 and is out of the range. The causes of the results to be out of range can be due to human errors. First of all, the NaOH solution could have been diluted as the burette used to fill the NaOH solution is rinse with distilled water and not with NaOH before use. This causes the concentration of NaOH to be slightly different from the standard solution that has been prepared. The same possibility does happen to the conical flask which is used to fill the HCl which will be titrated against NaOH where the flask only rinse with distilled water not with HCl. Thus, the concentration of HCl may be less than 0.01M. Besides that, the reading on the burette could have some minor error because during the recording of readings the meniscus shown on the burette is not clearly view. In order to correct the error, a white paper should be situated behind the burette in order to have a clearly view on the position of the meniscus so that a more accurate readings can be obtained.

Precaution steps:

Firstly, is the determination of the titration end point which is based on the colour changing of the indicator added to the conical flask. Confusion arises about when to stop the titration as the colour changes is difficult to be observed. Therefore, a white tile or a piece of white paper should be placed at the bottom of the conical flask so that the changes of colour can be easily seen. Next, NaOH solution will react quickly with the carbon dioxide in the air. Therefore NaOH should be cover when it is not in use. This is the reason the prepared standard solution of NaOH is closed with the cap. Lastly is the dilution or the preparation of the standard solution of NaOH. The standard solution is prepared in a 250mL volumetric flask by adding 5mL of NaOH and distilled water should be added to the graduated line in the flask. During the adding of distilled water, water could have overshoot the line and cause the concentration of the standard solution to be different from the expected concentration. Thus, use dropper to fill the water into flask when the meniscus level approaches to the graduated line of the flask to avoid the overshooting of distilled water during the preparation of standard solution.

Monday, December 5, 2011

Determining Molecule Weight by Freezing Point Depression Method

Objectives:

  1. To determine the freezing point of a substance from its cooling curve.
  2. To study the effect of foreign substance content on the freezing point of a solvent.
  3. To determine the molecular weight by using the freezing point depression method.

Introduction:

When non-volatile solute is added into a pure solvent, the freezing point of the solvent is depressed. This phenomenon is called the freezing point depression. In other word, the solution possesses a lower freezing point than the pure solvent. The freezing point depression can be explained as solvent molecules leaves the liquid phase and join to form the solid phase; they leave behind a lesser volume of solution where the solute particles may present. This results in the decrease of entropy of the solute particles. Thus, we can say that freezing point depression depends on the concentration of the solute particles present and it is called colligative properties. The colligative properties are solution that depends on the number of molecules in a constant volume of solvent but not the properties of the molecules. However, when the concentration of the solute becomes larger, where the interaction of solute becomes more important, therefore, the freezing point depression may depend on certain properties of the solute rather than the concentration.

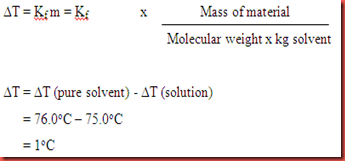
In this experiment, we will investigate the phenomenon of freezing point depression and determine the molar mass of substance X. The relationship between the lowering of the freezing point and the concentration of the solution is given by the following:

image

Methods:

A) Determination of the Freezing Point of Naphthalene

  1. A weighing boat was weighed.
  2. 5g of naphthalene was added to the weighing boat and weighted again.
  3. The naphthalene was transferred into a test tube.
  4. The naphthalene was melted using the water bath.
  5. When all had melted, the test tube from the water bath was dried and clamped on a retort stand and the initial temperature was recorded.
  6. The liquid naphthalene was stirred continuously and the temperature was recorded every 15 seconds until no more change in the gradient for the temperature vs. time graph.
  7. A graph of temperature versus time was plotted.
  8. The freezing point of naphthalene was determined.

B) Determination of the Freezing Point and Molecular Weight of a Substance

1. Approximately 0.5g of substance X was weighed.

2. The substance was added to the naphthalene in a test tube which was used in part A.

3. The melting and cooling steps were carried out.

4. The molecular weight of substance X was calculated.

[Kf for naphthalene is 6.8]

Apparatus and Materials:

  • Naphthalene
  • Substance X
  • Test tubes
  • Stopwatch
  • Beaker
  • Thermometer
  • Glass rod
  • Retort stand
  • Water bath

Results:

Part 1

Mass of weighing boat 1 = 2.5402g

Mass of naphthalene + weighing boat 1 = 7.5438g

Mass of naphthalene = 7.5438g – 2.5402g

= 5.0036g

Part 2

Mass of weighing boat 2 = 0.4515g

Mass of substance X + weighing boat 2 = 0.9502g

Mass of substance X = 0.4987g

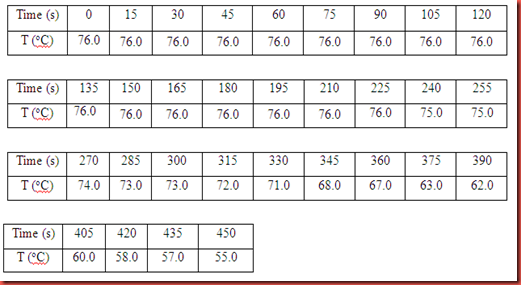
Table 1: The temperature readings for naphthalene.

image

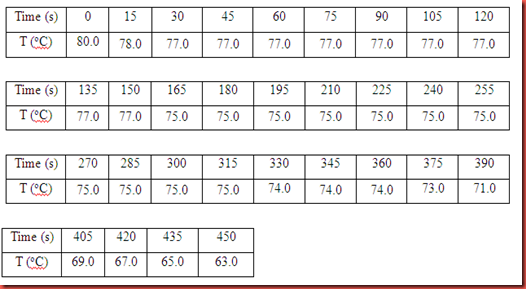
Table 2: The temperature readings for naphthalene and substance X.

image

Calculations:

image

Kf for naphthalene = 6.8 kg mol-1

Mass of substance X = 0.4987g

Mass of solvent in kg (naphthalene) = 0.0050036kg

image

Molecular weight of substance X = 677.55g mol-1

Discussion:

The application of freezing point depression is the determination of the molecular weight of the substance X. A weighed amount of the solute (substance X) is dissolved in a known mass of solvent (naphthalene). The freezing point of the solvent (the temperature at which solid and liquid phases are in equilibrium) is determined by the cooling of the solution. When the graph of the time versus temperature was plotted, a longest horizontal portion which is the constant temperature of the graph indicates the freezing of the pure liquid. However, a solution (mixture of substance X and naphthalene) will freeze over a range of temperature which is lower than the constant freezing point of the solvent (naphthalene). The plot will show a change of slope when solid solvent begins to form. The concentration of dissolved solute will steadily increases as the solvent freezes. This will cause the freezing point to continue decrease after the constant temperature. After obtaining the change of freezing point (∆T) and the value of Kf, then it is possible to calculate the molar mass of substance X.

Based on the graph plotted for the pure solvent (naphthalene), the freezing point obtained is 76.0oC. Whereas, the freezing point obtained for solution of substance X and naphthalene is 75.0oC. From the results obtained in the experiment, it obeys the theory of freezing point depression stating that the solution which contains naphthalene and substance X will have lower freezing point compared to the freezing point which contains only pure solvent (naphthalene). All the graphs used to determine the freezing point shows a staircase-like shape. For the graph of temperature versus time for naphthalene, initially, the temperature was 76.0oC and the temperature remained constant for more than 3 minutes. After that, the temperature continues to fall until the last second the time was recorded. The shape of this graph did not obtained like a staircase as the initial temperature start to become constant and continue to fall until the end of the experiment. During the starting of the experiment, the temperature of the solvent does not decrease because the solvent was not over heated in the water bath. Thus, the temperature measured in 0 second is the freezing point of the solvent. However, the graph for the solution of naphthalene and substance X exhibits a staircase-like shape. The initial temperature was 80oC then there is a slight decrease until it reaches 75oC, the equilibrium state of the substance which is the conversion of liquid to solid state. After that, the temperature will start to decrease until the end of the experiment.

The experimental freezing point was selected based on the temperature that remains the longest period for all the three different solution. This is because during this period, temperature do not rise until all the solid has melt as heat of fusion is taken up to convert the solid state substance to liquid state.

In order to make sure the results obtained obeys the theory, some of the precautions steps should be taken in order to prevent results error. Firstly, all apparatus used should be washed and rinsed thoroughly with distilled water to avoid contamination occurrence. Furthermore, during the solution is left to melt from solid to liquid, the content should be stirred in order to maintain thermal equilibrium. Uneven distribution of heat in the solution will caused the temperature obtained not accurate. Thus, the freezing point depression will be affected. In order to dispose the substances inside the test tube, the substances was melted in the water bath and disposed into the fume chamber.